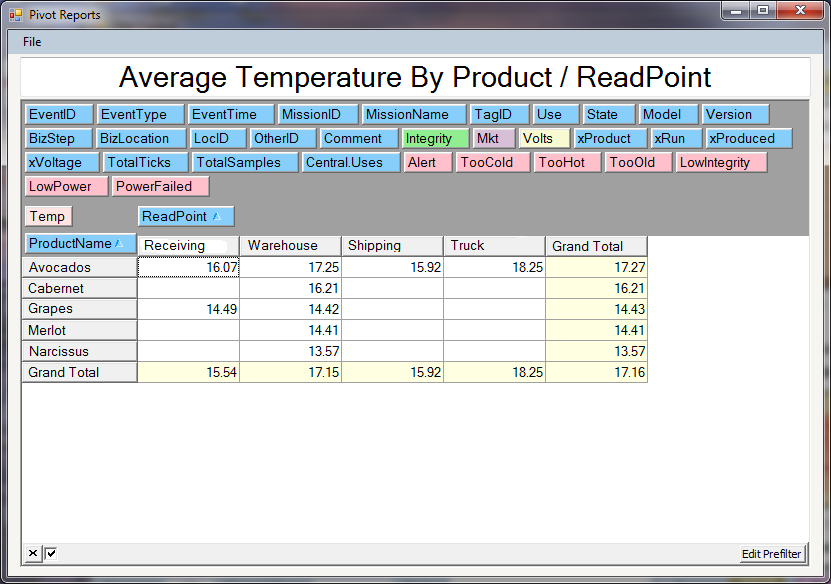
A Pivot Report allows you to automatically extract, organize, and summarize Event data. You can use Pivot Reports to analyze Events, make comparisons, detect patterns and relationships, and discover trends. You can quickly and easily summarize and analyze large numbers of Events by dragging and dropping columns to different rows, columns, or summary positions.
The easiest way to understand Pivot Reports is to experiment with making changes to sample reports. Use the File/Open menu in the
Pivot Reporter to load one of the sample reports. Then, see what happens when you drag Event fields to the Row, Column, and Summary areas of the report.
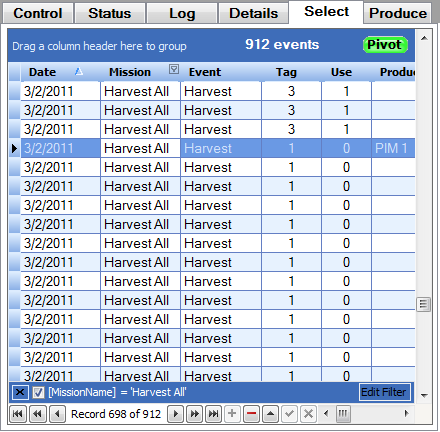
Pivot Reports use Event data that has been selected from the database using the Select View. For maximum efficiency, as much filtering of Events as possible should be done in the Select View before asking for a Pivot Report. This is because Select filtering is done primarily on the database server, avoiding the download of unwanted Events. The data for the Pivot Reporter, however, must all be downloaded before the report can be generated.