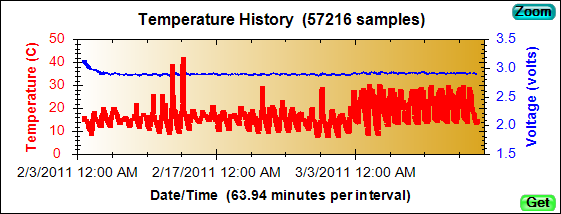
The History keeps track of temperature (and other sensor) samples by logging each sample as it is taken. This results in a time-ordered record of the samples, useful if you need to know, for example, who had custody of the product when a particular temperature excursion occurred. When displayed graphically, the History appears as a line chart like the one shown below.
Most traditional data loggers keep track of temperature samples this way. The problem they have is that there is a limited amount of memory available to store samples. To make sure that you don't run out of memory, the sample rate has to be adjusted to match the expected length of time that the product will be monitored. This can result in a sample rate that is too slow to catch important temperature events.
PIMs solve this problem by compressing the History as needed. A PIM can keep up to 8192 sensor samples in its History memory. Initially, every temperature sample is saved and displayed. At the default sample rate of 60-seconds, the History can store 1 sample per interval for the first 5.6 days that the PIM runs. When the memory is full, the History is compressed by doubling the interval and keeping only the minimum and maximum values for each interval. This technique allows a History to be maintained for the full time the PIM runs without ever missing a significant temperature excursion. The actual sample rate (60-seconds) never changes, just the reporting interval. See
History Chart to see how this appears graphically.