|
|
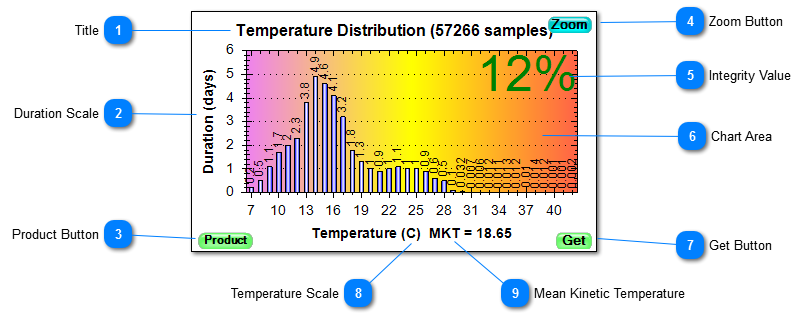
 TitleAs the title suggests, this chart shows how long the PIM was at any given temperature. A temperature reading is made every sample period (60 seconds by default). A count associated with that temperature is then incremented. When the chart is displayed, a bar is shown for each temperature with the height of the bar indicating the total amount of time spent at that temperature. The total number of samples represented in the chart is displayed in the title.
The default setting for the Histogram is to display a bar for each 1 degree Celsius. That would mean that the bar labeled 16 would include temperature samples between 16.0 C and 16.9C. Users who prefer their temperatures in Fahrenheit can use the Change Settings Mission to change to a more "Fahrenheit-friendly" mapping of temperatures-to-bins.
| |
 Duration ScaleThe Duration Scale indicates the time units being used. This time unit is automatically picked to match the data. The duration value is displayed at the top of each bar.
| |
 Product ButtonPressing the Product Button displays a Compute Integrity window. You can select a product by name or specify a custom life curve. The Histogram and History charts will then display the integrity of that product as if it had been subjected to the displayed temperature distribution. | |
 Zoom ButtonPressing the Zoom Button causes the Histogram to expand to fill almost the entire PIM Control window. Pressing it again returns the Histogram to its normal size. Portions of the Histogram can be zoomed by selecting a rectangular area of interest with the mouse. Use the Chart Context Menu to undo the partial zoom. | |
 Integrity ValueThis portion of the Histogram displays the Product Integrity value, when applicable. The value is displayed as a percentage, representing the percentage of useful life left in the product. It starts at 100% and declines to 0% at a rate dependent on the temperature distribution. If the Check Alarms Step detects a lower-than-expected Integrity value, it is displayed in red. | |
 Chart AreaRight-clicking the mouse anywhere in the Chart Area will display the Chart Context Menu. Dragging the mouse while holding down the left button will select an area to enlarge. Dragging the mouse with the left button and the Shift key down will scroll the Chart Area. | |
 Get ButtonIf you have a PIM positioned in range of the reader, pressing this button will read and display the Histogram from the PIM.
| |
 Temperature ScaleThe temperature scale indicates whether temperatures are being displayed in Celsius or Fahrenheit. Use Edit Menu / Preferences to change these units. The change will occur the next time the Histogram is displayed. | |
 Mean Kinetic Temperature | |
|
|