|
|
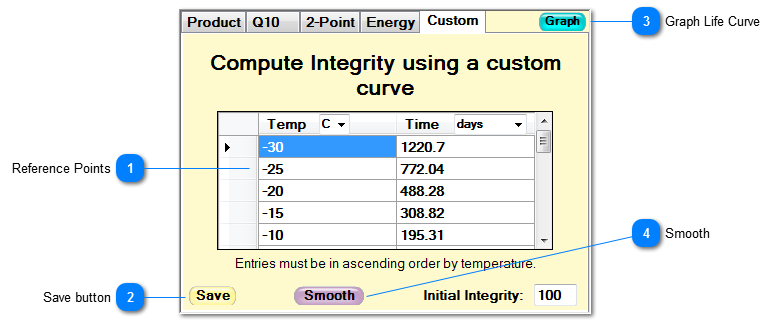
 Reference PointsEnter temperature/hours pairs representing how many hours the product would last if constantly kept at that temperature. Pairs must be listed in ascending temperature order. There is no limit on how many pairs you can enter, but there isn't much value in using more than 20.
| |
 Save buttonClick here to save this Life Curve and assign it a product name.
| |
 Graph Life CurveClick here to display the Life Curve graphically.
| |
 SmoothAdvanced Feature - Click here to "fill-in" the curve with entries every 5 degrees C, from -30C to 70C. Custom curves use linear interpolation for "in-between" temperatures. If the space between points is 5C or less, the error introduced by this is negligible. This feature lets you specify a small number of data points and then connect the points with Arrhenius curves, thus filling in the >5C gaps. It's not likely you will ever need to use this, but if you have a product with different Q10s in different temperature ranges, this will handle it.
| |
|
|