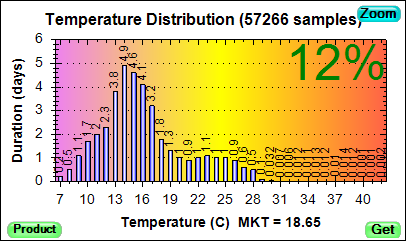
The Histogram keeps track of temperature samples by counting how many samples occurred for any given temperature. Temperatures are partitioned into "bins" representing ranges of temperature. Each time the temperature is sampled, a matching bin is found and its count is incremented. When displayed graphically, the Histogram appears as a
bar chart like the one below.
The primary reason to have a Histogram, in addition to a
History, is that the Histogram can store all the data necessary to compute a product's
Integrity in a very small amount of memory. That's because the Integrity depends only upon how long the product has been at each temperature, not on the order in which the temperatures occurred. This lets you get an Integrity value from a PIM much faster than you could from a traditional data logger.
By default, there are 100 bins, each representing 1 degree Celsius. This gives the histogram a 1 degree resolution through the entire temperature range supported by the PIM (-30C to 70C). That resolution should be adequate for almost any application. Users who prefer their temperatures in Fahrenheit can use the
Change Settings Mission to change to a more "Fahrenheit-friendly" mapping of temperatures-to-bins.