The Compare Histories Tool lets you compare the Temperature Histories from several PIMs by displaying them, synchronized, on the same chart. The PIMs to be compared must first be selected in the
Select View by clicking on a HarvestData event. Additional HarvestData events can be selected with Ctrl-click. Each selected Temperature History will be displayed in a different color, with the Legend identifying the corresponding PIMs. If the PIM had a "Label" Item in the
Log at the time it was harvested, that label value will be displayed in the Legend (see the
Print Label Step). Otherwise, the unique ID number of the PIM is displayed.
To print or save the chart, right-click the mouse anywhere in the Background to display the
Chart Context Menu.
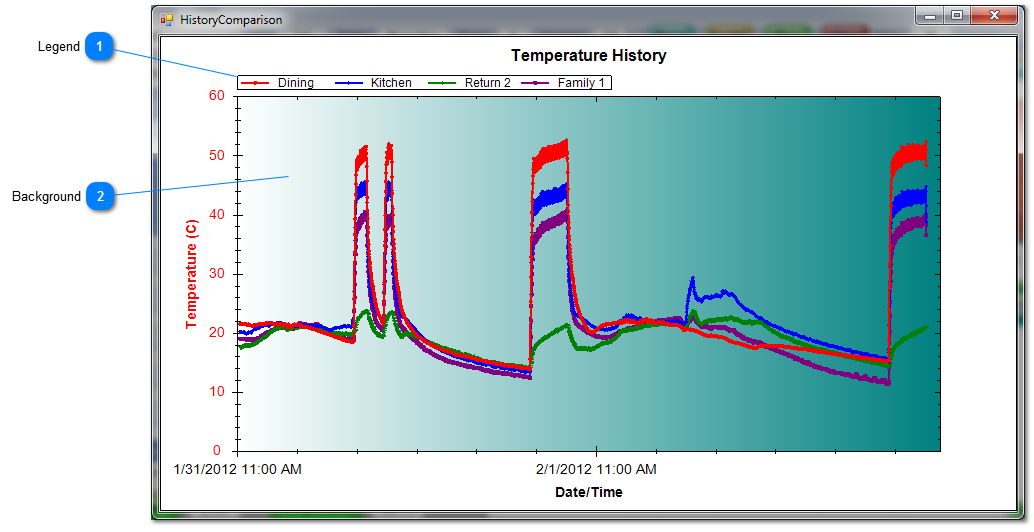
 LegendEach History is color coded. The Legend indicates the "Label" value or the PIM ID that corresponds to each color. See the discussion above.
|
|
 BackgroundRight-click the mouse anywhere in the Background to display the Chart Context Menu. This allows you to save or print the comparison chart.
|
|