|
|
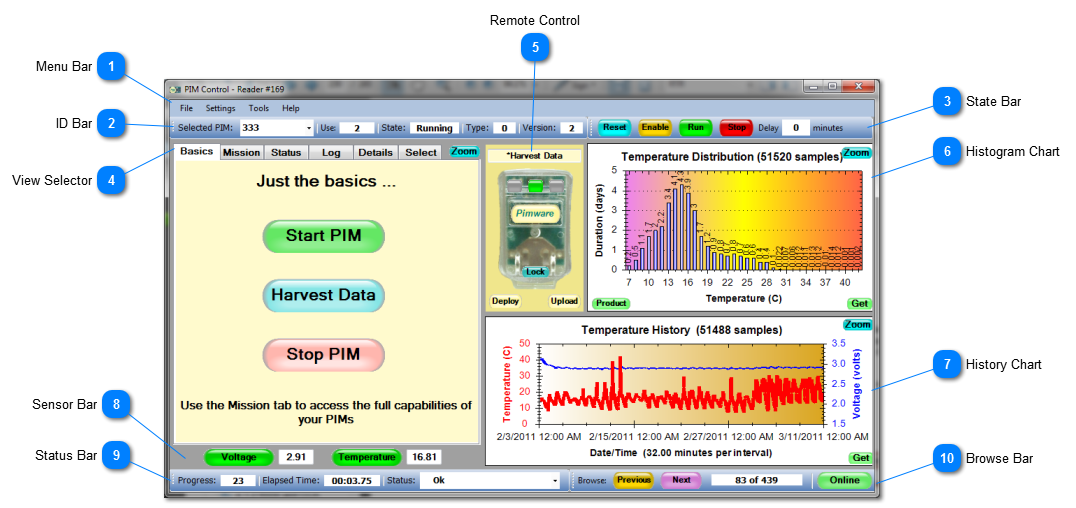
 Menu BarThe Menu Bar provides the following drop-down menus:
-
File Menu - for selecting and printing reports.
-
-
-
| |
 ID BarThe ID Bar displays the PIM ID number and other identifying information about the most recently selected PIM. Any operation performed on a PIM results in an Event being generated. The data retrieved during that Event is displayed in the PIM Control window and, usually, saved in the database. The Event data can be retrieved from the database using the Select View.
| |
 State BarThe State Bar allows you to easily change the operating state of a PIM. Select State Bar for a full explanation of the states. | |
 View SelectorThere is more information available than there is room in the PIM Control window. The View Selector lets you select which of this information to make visible. The available views are:
-
Basics - easy access to the three most important operations on a PIM: starting, stopping, and reading data.
-
Mission - lets you select an existing Mission or create a new Mission.
-
Status - displays status information from the PIM such as the time it was started, how long it has run, and the sample rate.
-
Log - displays the contents of the PIM log and allows new items to be added to the log.
-
Details - displays the full XML data record that is sent to the database.
-
Select - lets you browse, filter, and select events from the database. Also lets you create pivot reports.
| |
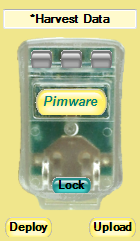
 Remote Control
Pressing the Remote Control button tells PIM Control to execute the current Mission. The Mission could be something simple like starting a PIM, or complex like checking the product integrity and taking different actions depending on the results. The Mission will be executed once for each PIM within range of the reader.
| |
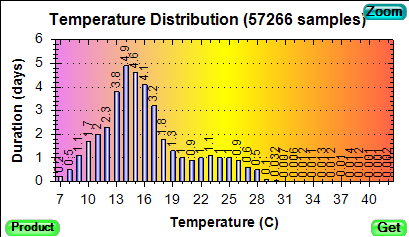
 Histogram ChartThe Histogram Chart displays the temperature distribution data from the most recent event. The chart can be zoomed to fill the whole PIM Control window and subsets of the chart may be zoomed to see even more detail. | |
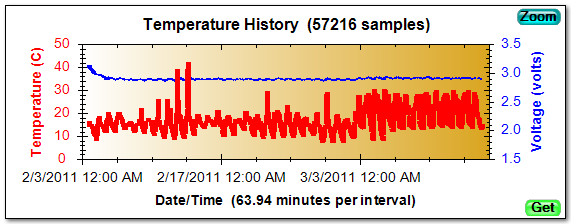
 History ChartThe History Chart displays the time-ordered history of temperature (and other sensor) readings. The chart can be zoomed to fill the whole PIM Control window and subsets of the chart may be zoomed to see even more detail. | |
 Sensor BarThe Sensor Bar displays the temperature and voltage readings from the most recent event. Quick Buttons allow you to easily interrogate either sensor. | |
 Status BarThe Status Bar displays the status of the current PIM operation. It counts the number of messages sent to the PIM, times the entire operation, and keeps a history of recent operations. | |
 Browse BarThe Browse Bar lets you step through entries in the Select View while displaying other views. Each entry represents a PIM event and data from the event is displayed in the Histogram, History, Status, Log, and Sensor areas. The Online button lets you select whether you are Online to a remote database or Offline to a local database (see the Database Tool). | |
|
|